您现在的位置是:首页 >技术交流 >5.基于图神经网络的点云分类网站首页技术交流
5.基于图神经网络的点云分类
在本教程中,您将学习使用图神经网络进行点云分类的基本工具。在这里,我们得到了一个对象或点集的数据集,我们希望以这样一种方式嵌入这些对象,即在手头有任务的情况下,它们是线性可分离的。具体而言,原始点云被用作神经网络的输入,并将学习捕捉有意义的局部结构,以便对整个点集进行分类。
让我们来看看PyTorch Geometric提供的一个简单的数据集,GeometricShapes 数据集。
一、数据处理
GeometricShapes数据集包含40种不同的二维和三维几何形状,如立方体、球体和金字塔。每种形状都有两个不同的版本,一个用于训练神经网络,另一个用于评估其性能。
%matplotlib inline
import matplotlib.pyplot as plt
from mpl_toolkits.mplot3d import Axes3D

def visualize_mesh(pos, face):
    fig = plt.figure()
    ax = fig.add_subplot(projection='3d') # 创建一个带有3D投影的AxesSubplot对象
    ax.axes.xaxis.set_ticklabels([]) # 隐藏3D坐标轴刻度
    ax.axes.yaxis.set_ticklabels([])
    ax.axes.zaxis.set_ticklabels([])
    ax.plot_trisurf(pos[:, 0], pos[:, 1], pos[:, 2], triangles=data.face.t(), antialiased=False)
    plt.show()
from torch_geometric.datasets import GeometricShapes

dataset = GeometricShapes(root='data/GeometricShapes')
print(dataset)

data = dataset[0]
print(data)
visualize_mesh(data.pos, data.face)

data = dataset[4]
print(data)
visualize_mesh(data.pos, data.face)

我们可以通过PyTorch Geometric轻松导入和实例化GeometricShapes数据集,并打印出一些信息,例如数据集的描述或关于单个示例中存在的属性的一些信息。特别地,每个对象被表示为网格,包含关于pos中的顶点和面中顶点的三角形连通性的信息(具有shape[3,num_faces])。
二、点云生成
由于我们对点云分类感兴趣,我们可以通过使用“transforms”将网格变换为点。
在这里,PyTorch Geometric提供了torch_geometric.transforms.SamplePoints变换,该变换将根据网格面的面积对网格面上固定数量的点进行均匀采样。
我们可以通过dataset.transform = SamplePoints(num=...)将此转换添加到数据集中。每次从数据集中访问示例时,都会调用转换过程:
def visualize_points(pos, edge_index=None, index=None):
    fig = plt.figure(figsize=(4, 4))
    if edge_index is not None:
        for (src, dst) in edge_index.t().tolist():
            src = pos[src].tolist()
            dst = pos[dst].tolist()
            plt.plot([src[0], dst[0]], [src[1], dst[1]], linewidth=1, color='black')
    if index is None:
        plt.scatter(pos[:, 0], pos[:, 1], s=50, zorder=1000)
    else:
        mask = torch.zeros(pos.size(0), dtype=torch.bool)
        mask[index] = True
        plt.scatter(pos[~mask, 0], pos[~mask, 1], s=50, color='lightgray', zorder=1000)
        plt.scatter(pos[mask, 0], pos[mask, 1], s=50, zorder=1000)
    plt.axis('off')
    plt.show()
import torch
from torch_geometric.transforms import SamplePoints

torch.manual_seed(42)
dataset.transform = SamplePoints(num=256)

data = dataset[0]
print(data)
visualize_points(data.pos, data.edge_index)

data = dataset[4]
print(data)
visualize_points(data.pos)

三、PointNet++
由于我们现在已经准备好使用点云数据集,让我们看看如何通过图神经网络和 PyTorch Geometric库的帮助来处理它。
在这里,我们将重新实现PointNet++架构,这是通过图神经网络进行点云分类/分割的开创性工作。
PointNet++通过遵循简单的分组、邻域聚合和下采样方案来迭代处理点云:
- 分组阶段构建一个图,其中连接了附近的点。通常,这是通过?-最近邻居搜索或通过球查询(将半径内的所有点连接到查询点)。
- 邻域聚合阶段执行图形神经网络层,该层为每个点聚合来自其直接邻域的信息(由前一阶段构建的图给出)。这允许PointNet++以不同的规模捕获局部信息。
- 下采样阶段实现了适用于具有潜在不同大小的点云的池化方案。我们将暂时忽略这一阶段,稍后再回到这一阶段。

阶段1:通过动态图生成进行分组
PyTorch Geometric通过其辅助程序包torch_cluster提供用于动态图形生成的实用程序,特别是通过?-最近邻和球查询生成图。
from torch_cluster import knn_graph

data = dataset[0]
data.edge_index = knn_graph(data.pos, k=6)
print(data.edge_index.shape)
visualize_points(data.pos, edge_index=data.edge_index)

data = dataset[4]
data.edge_index = knn_graph(data.pos, k=6)
print(data.edge_index.shape)
visualize_points(data.pos, edge_index=data.edge_index)

在这里,我们从torch_cluster导入knn_graph函数,并通过传入输入点pos和最近邻居k的数量来调用它。作为输出,我们将接收shape[2,num_edges]的edge_index张量,该张量将保存每列中源和目标节点索引的信息(称为 the sparse matrix COO format)。
阶段2:邻居聚合
PointNet++层遵循一个简单的神经消息传递方案,该方案通过:
h i ( ℓ + 1 ) = max j ∈ N ( i ) MLP ( h j ( ℓ ) , p j − p i ) mathbf{h}^{(ell + 1)}_i = max_{j in mathcal{N}(i)} extrm{MLP} left( mathbf{h}_j^{(ell)}, mathbf{p}_j - mathbf{p}_i ight) hi(ℓ+1)=j∈N(i)maxMLP(hj(ℓ),pj−pi)
- h i ( ℓ ) ∈ R d mathbf{h}_i^{(ell)} in mathbb{R}^d hi(ℓ)∈Rd denotes the hidden features of point i i i in layer ℓ ell ℓ.
- p i ∈ R 3 mathbf{p}_i in mathbb{R}^3 pi∈R3 denotes the position of point i i i.
我们可以利用MessagePassing 接口来实现这个层。
MessagePassing接口通过自动处理消息传播,帮助我们创建消息传递图神经网络。
在这里,我们只需要定义其message函数以及使用哪种聚合方案,例如,aggr="max" (see here for the accompanying tutorial):
from torch.nn import Sequential, Linear, ReLU
from torch_geometric.nn import MessagePassing


class PointNetLayer(MessagePassing):
    def __init__(self, in_channels, out_channels):
        # Message passing with "max" aggregation.
        super().__init__(aggr='max')

        # Initialization of the MLP:
        # Here, the number of input features correspond to the hidden node
        # dimensionality plus point dimensionality (=3).
        self.mlp = Sequential(Linear(in_channels + 3, out_channels),
                              ReLU(),
                              Linear(out_channels, out_channels))

    def forward(self, h, pos, edge_index):
        # Start propagating messages.
        return self.propagate(edge_index, h=h, pos=pos)

    def message(self, h_j, pos_j, pos_i):
        # h_j defines the features of neighboring nodes as shape [num_edges, in_channels]
        # pos_j defines the position of neighboring nodes as shape [num_edges, 3]
        # pos_i defines the position of central nodes as shape [num_edges, 3]

        input = pos_j - pos_i  # Compute spatial relation.

        if h_j is not None:
            # In the first layer, we may not have any hidden node features,
            # so we only combine them in case they are present.
            input = torch.cat([h_j, input], dim=-1)

        return self.mlp(input)  # Apply our final MLP.
可以看出,在PyTorch Geometric中实现PointNet++层非常简单。
在 __init__ 函数中,我们首先定义我们想要应用 max aggregation,然后初始化MLP,该MLP负责将相邻节点特征以及源节点和目标节点之间的空间关系转换为(可训练的)消息。
在 forward 函数中,我们可以开始基于edge_index传播消息,传入创建消息所需的所有内容。
在message 函数中,我们现在可以分别通过*_j 和 *_i访问相邻节点和中心节点信息,并为每个连接返回一条消息。
四、网络架构
我们可以使用 knn_graph 和 PointNetLayer 来定义我们的网络架构。
在这里,我们感兴趣的是一种能够以 mini-batch fashion在点云上操作的架构。
PyTorch Geometric通过创建稀疏块对角邻接矩阵(由 edge_index定义)和节点维度上的串联特征矩阵(如 pos),在小批量上实现并行化。
为了区分小批量中的实例,存在一个名为 batch 的特殊向量,(shape [num_nodes]),其将每个节点映射到该批中的其各自的图:
batch
=
[
0
⋯
0
,
1
⋯
n
−
2
n
−
1
⋯
n
−
1
]
⊤
extrm{batch} = {[ 0 cdots 0, 1 cdots n-2 n-1 cdots n - 1 ]}^{ op}
batch=[0⋯0,1⋯n−2n−1⋯n−1]⊤
我们需要使用这个batch向量来生成 knn_graph ,因为我们不想连接来自不同示例的节点。
这样,我们的整体PointNe架构看起来如下:
import torch
import torch.nn.functional as F
from torch_cluster import knn_graph
from torch_geometric.nn import global_max_pool


class PointNet(torch.nn.Module):
    def __init__(self):
        super().__init__()

        torch.manual_seed(12345)
        self.conv1 = PointNetLayer(3, 32)
        self.conv2 = PointNetLayer(32, 32)
        self.classifier = Linear(32, dataset.num_classes)

    def forward(self, pos, batch):
        # Compute the kNN graph:
        # Here, we need to pass the batch vector to the function call in order
        # to prevent creating edges between points of different examples.
        # We also add `loop=True` which will add self-loops to the graph in
        # order to preserve central point information.
        edge_index = knn_graph(pos, k=16, batch=batch, loop=True)

        # 3. Start bipartite message passing.
        h = self.conv1(h=pos, pos=pos, edge_index=edge_index)
        h = h.relu()
        h = self.conv2(h=h, pos=pos, edge_index=edge_index)
        h = h.relu()
        print(h.shape)

        # 4. Global Pooling.
        h = global_max_pool(h, batch)  # [num_examples, hidden_channels]
        print(h.shape)

        # 5. Classifier.
        return self.classifier(h)


model = PointNet()
print(model)

在这里,我们通过继承torch.nn.Module来创建我们的网络架构,构造函数中初始化两个PointNetLayer模块和一个final linear classifier(torch.nn.Linear)。
在forward方法中,我们首先基于节点的位置pos 动态生成一个16-nearest neighbor graph 。基于得到的图连通性,我们应用了两个基于图的卷积算子,并通过ReLU非线性对它们进行了增强。
第一个操作获取3个输入特征(节点的位置),并将它们映射到32个输出特征。
之后,每个点都保存关于its 2-hop neighborhood的信息,并且应该已经能够区分简单的局部形状。
接下来,我们应用 global graph readout function,即global_max_pool,对于每个示例,其取沿着节点维度的最大值。
最后,我们应用线性分类器将剩余的32个特征映射到40个类中的一个。
五、训练程序
我们现在准备编写两个简单的过程,分别在训练和测试数据集上训练和测试我们的模型。
如果你不是PyTorch的新手,这个方案对你来说应该很熟悉。
import torch
from torch_geometric.transforms import SamplePoints
from torch_cluster import knn_graph
from torch_geometric.nn import global_max_pool
from torch.nn import Sequential, Linear, ReLU
from torch_geometric.nn import MessagePassing
from torch_geometric.loader import DataLoader
from torch_geometric.datasets import GeometricShapes
import matplotlib.pyplot as plt

dataset = GeometricShapes(root='data/GeometricShapes')

class PointNetLayer(MessagePassing): # MessagePassing:消息传播基类
    def __init__(self, in_channels, out_channels):
        super().__init__(aggr='max')
        self.mlp = Sequential(Linear(in_channels + 3, out_channels), ReLU(), Linear(out_channels, out_channels))

    def forward(self, h, pos, edge_index):
        return self.propagate(edge_index, h=h, pos=pos)

    def message(self, h_j, pos_j, pos_i):
        input = pos_j - pos_i
        if h_j is not None:
            input = torch.cat([h_j, input], dim=-1) # 按列拼接
        return self.mlp(input)


class PointNet(torch.nn.Module):
    def __init__(self):
        super().__init__()
        self.conv1 = PointNetLayer(3, 32)
        self.conv2 = PointNetLayer(32, 32)
        self.classifier = Linear(32, dataset.num_classes)

    def forward(self, pos, batch):
        edge_index = knn_graph(pos, k=16, batch=batch, loop=True) # 在每个batch里,各自生成k最近邻图
        h = self.conv1(h=pos, pos=pos, edge_index=edge_index)
        h = h.relu()
        h = self.conv2(h=h, pos=pos, edge_index=edge_index)
        h = h.relu()
        h = global_max_pool(h, batch)
        return self.classifier(h)

model = PointNet()
print(model)

# 准备数据,并进行批传入
# GeometricShapes数据集包含40种不同的2D和3D几何形状,如立方体、球体和金字塔
# 每种形状都有两个不同的版本,一个用于训练神经网络,另一个用于评估其性能
train_dataset = GeometricShapes(root='data/GeometricShapes', train=True, transform=SamplePoints(128)) # 每个样本采样128个点
test_dataset = GeometricShapes(root='data/GeometricShapes', train=False, transform=SamplePoints(128))
# 构建Dataloader
train_loader = DataLoader(train_dataset, batch_size=10, shuffle=True) # 一批为10个样本
test_loader = DataLoader(test_dataset, batch_size=10)

# 模型、优化器和损失函数
model = PointNet()
optimizer = torch.optim.Adam(model.parameters(), lr=0.01) # Adam算法
criterion = torch.nn.CrossEntropyLoss() # 交叉熵损失


def train(model, optimizer, loader):
    model.train()
    total_loss = 0
    for data in loader:
        optimizer.zero_grad()  # 梯度清零
        logits = model(data.pos, data.batch)  # 前向传播
        loss = criterion(logits, data.y)  # 计算损失
        loss.backward()  # 反向传播
        optimizer.step()  # 参数更新
        total_loss += loss.item() * data.num_graphs

    return total_loss / len(train_loader.dataset) # 训练样本平均损失


def test(model, loader):
    model.eval()
    total_correct = 0
    for data in loader:
        logits = model(data.pos, data.batch)
        pred = logits.argmax(dim=-1)
        total_correct += int((pred == data.y).sum())

    return total_correct / len(loader.dataset)


loss_history = [] # 存储训练损失
test_acc_history = [] # 存储测试准确率
for epoch in range(101):
    loss = train(model, optimizer, train_loader)
    test_acc = test(model, test_loader)
    if epoch % 20 == 0:
        print(f'Epoch: {epoch:02d}, Loss: {loss:.4f}, Test Accuracy: {test_acc:.4f}')

    loss_history.append(loss)
    test_acc_history.append(test_acc)


# 画训练损失和测试集准确率随Epoch变化图
def plot_loss_with_acc(loss_history, test_acc_history):
    Epoch_list = list(range(101))  # epoch:0-100列表
    fig, ax = plt.subplots() # 创建一个 Figure 对象和一个 Axes 对象
    ax.plot(Epoch_list, loss_history, color='blue') # loss图
    ax2 = ax.twinx() # 创建一个共享 x 轴的第二个 y 轴
    ax2.plot(Epoch_list, test_acc_history, color='red') # TestAcc图

    # 设定左边Loss轴标签和颜色
    ax.set_ylabel('Loss', color='blue')
    ax.tick_params(axis='y', labelcolor='blue')

    # 设定右边ValAcc轴标签和颜色
    ax2.set_ylabel('TestAcc', color='red')
    ax2.tick_params(axis='y', labelcolor='red')

    plt.title('Training Loss & Test Accuracy')
    plt.show()

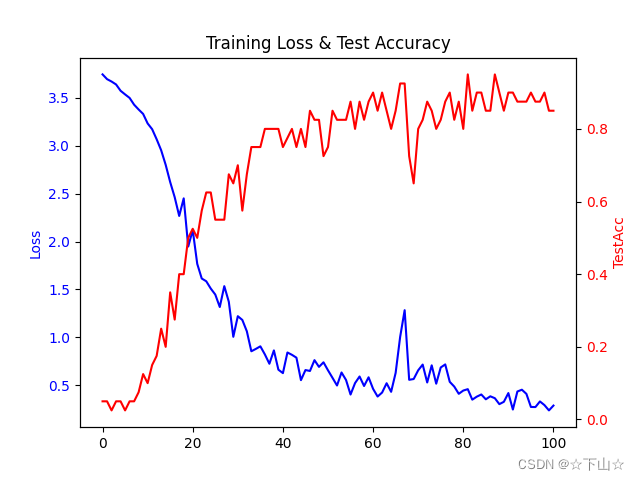
plot_loss_with_acc(loss_history, test_acc_history) # 画图


正如我们所看到的,即使每个类只训练一个例子,我们也能够实现大约85%的测试准确率(请注意,我们当然可以通过更长时间的训练和使用更深层次的神经网络来提高性能)。
本文内容参考:PyG官网


 QT多线程的5种用法,通过使用线程解决UI主界面的耗时操作代码,防止界面卡死。...
 U8W/U8W-Mini使用与常见问题解决
 stm32使用HAL库配置串口中断收发数据(保姆级教程)
 分享几个国内免费的ChatGPT镜像网址(亲测有效)
 Allegro16.6差分等长设置及走线总结