您现在的位置是:首页 >技术教程 >深度学习 GNN图神经网络(四)线性回归之ESOL数据集水溶性预测网站首页技术教程
深度学习 GNN图神经网络(四)线性回归之ESOL数据集水溶性预测
简介深度学习 GNN图神经网络(四)线性回归之ESOL数据集水溶性预测
一、前言
本文旨在使用化合物分子的SMILES字符串进行数据模型训练,对其水溶性的值进行预测。
之前的文章《深度学习 GNN图神经网络(三)模型思想及文献分类案例实战》引用的Cora数据集只有一张图,属于图神经网络的节点分类问题。本文介绍的是多图批量训练的线性回归问题,在文章最后也讨论了图分类问题。
二、ESOL数据集
本文使用的是ESOL数据集,在文章《如何将化学分子SMILES字符串转化为Pytorch图数据结构——ESOL分子水溶性数据集解析》中有详细介绍,在此不作详述。
三、加载数据集
from torch_geometric.datasets import MoleculeNet

dataset = MoleculeNet(root="data", name="ESOL")

print('num_features:',dataset.num_features)
print('num_classes:',dataset.num_classes)
print('num_node_features',dataset.num_node_features)
print("size:", len(dataset))

d=dataset[10]
print("Sample:", d)
print("Sample y:", d.y)
print("Sample num_nodes:",d.num_nodes)
print("Sample num_edges:",d.num_edges)
这里可以得到数据集的一些基本信息:
num_features: 9
num_classes: 734
num_node_features 9
size: 1128
Sample: Data(x=[6, 9], edge_index=[2, 12], edge_attr=[12, 3], smiles='O=C1CCCN1', y=[1, 1])
Sample y: tensor([[1.0700]])
Sample num_nodes: 6
Sample num_edges: 12
四、数据拆分
将数据集拆分为训练数据和测试数据:
from torch_geometric.loader import DataLoader
data_size = len(dataset)
batch_size = 128
train_data=dataset[:int(data_size*0.8)]
test_data=dataset[int(data_size*0.8):]

train_loader = DataLoader(train_data, batch_size=batch_size, shuffle=True)
test_loader = DataLoader(test_data, batch_size=len(test_data))
五、构造模型
import torch
import torch.nn as nn
from torch_geometric.nn import GCNConv
import matplotlib.pyplot as plt
from torch_geometric.nn import global_mean_pool

device = torch.device("cuda:0" if torch.cuda.is_available() else "cpu")

hidden_channels = 64

class GNN(nn.Module):

    def __init__(self):
        # 初始化Pytorch父类
        super().__init__()

        self.conv1=GCNConv(dataset.num_node_features, hidden_channels)
        self.conv2=GCNConv(hidden_channels, hidden_channels)
        self.conv3 = GCNConv(hidden_channels, hidden_channels)
        self.conv4 = GCNConv(hidden_channels, hidden_channels)
        self.out = nn.Linear(hidden_channels, 1)

        # 创建损失函数,使用均方误差
        self.loss_function = nn.MSELoss()

        # 创建优化器,使用Adam梯度下降
        self.optimiser = torch.optim.Adam(self.parameters(), lr=0.005,weight_decay=5e-4)

        # 训练次数计数器
        self.counter = 0
        # 训练过程中损失值记录
        self.progress = []

    # 前向传播函数
    def forward(self, x, edge_index,batch):

        x=x.to(device)
        edge_index=edge_index.to(device)
        batch=batch.to(device)

        x=self.conv1(x, edge_index)
        x=x.relu()
        x=self.conv2(x, edge_index)
        x=x.relu()
        x=self.conv3(x, edge_index)
        x=x.relu()
        x=self.conv4(x, edge_index)
        x=x.relu()

        # 全局池化
        x = global_mean_pool(x, batch)  # [x, batch]

        out=self.out(x)
        return out

    # 训练函数
    def train(self, data):

        # 前向传播计算,获得网络输出
        outputs = self.forward(data.x.float(),data.edge_index,data.batch)

        # 计算损失值
        y=data.y.to(device)
        loss = self.loss_function(outputs, y)

        # 累加训练次数
        self.counter += 1

        # 每10次训练记录损失值
        if (self.counter % 10 == 0):
            self.progress.append(loss.item())

        # 每1000次输出训练次数
        if (self.counter % 1000 == 0):
            print(f"counter={self.counter}, loss={loss.item()}")

        # 梯度清零, 反向传播, 更新权重
        self.optimiser.zero_grad()
        loss.backward()
        self.optimiser.step()

    # 测试函数
    def test(self, data):
        # 前向传播计算,获得网络输出
        outputs = self.forward(data.x.float(),data.edge_index,data.batch)

        # 把绝对值误差小于1的视为正确,计算准确度
        y=data.y.to(device)
        acc=sum(torch.abs(y-outputs)<1)/len(data.y)
        return acc

    # 绘制损失变化图
    def plot_progress(self):
        plt.plot(range(len(self.progress)),self.progress)
六、训练模型
model = GNN()
model.to(device)

for i in range(1001):
    for data in train_loader:
        # print(data,'num_graphs:',data.num_graphs)
        model.train(data)
counter=1000, loss=1.4304862022399902
counter=2000, loss=0.9842458963394165
counter=3000, loss=0.27240827679634094
counter=4000, loss=0.23295772075653076
counter=5000, loss=0.38499030470848083
counter=6000, loss=1.470423698425293
counter=7000, loss=0.845589816570282
counter=8000, loss=0.15707021951675415
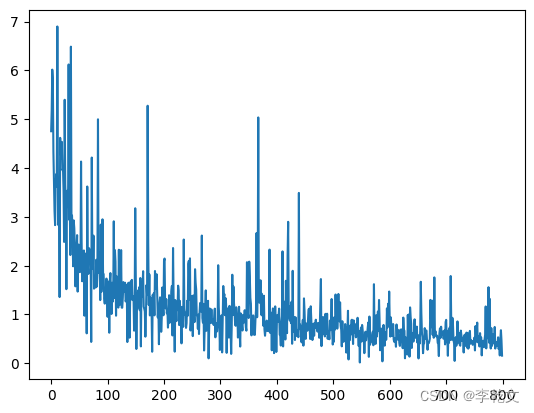
绘制损失值变化图::
model.plot_progress()

七、测试结果
#torch.set_printoptions(precision=4,sci_mode=False) #pytorch不使用科学计数法显示

for data in test_loader:
    acc=model.test(data)
    print(acc)
tensor([0.8186], device='cuda:0')
可以看到,预测值误差小于1的占了81.86%,效果还行。
八、分类问题
对于图分类问题,其实也差不多。只需要修改下Linear网络层:
self.out = Linear(hidden_channels, dataset.num_classes)
这样预测结果就会有num_classes个,取最大值的下标索引即可。
伪代码为:
pred=outputs.argmax(dim=1)
correct += int((pred == data.y).sum())
参考文献
[1] https://pytorch-geometric.readthedocs.io/en/latest/get_started/colabs.html
[2] https://zhuanlan.zhihu.com/p/504978470
风语者!平时喜欢研究各种技术,目前在从事后端开发工作,热爱生活、热爱工作。


 U8W/U8W-Mini使用与常见问题解决
 QT多线程的5种用法,通过使用线程解决UI主界面的耗时操作代码,防止界面卡死。...
 stm32使用HAL库配置串口中断收发数据(保姆级教程)
 分享几个国内免费的ChatGPT镜像网址(亲测有效)
 Allegro16.6差分等长设置及走线总结