您现在的位置是:首页 >技术教程 >2023年6月最新|大屏可视化配置网站首页技术教程
2023年6月最新|大屏可视化配置
大屏可视化配置
运行环境:VScode
一、可视化适配
大屏下显示一般都是16:9尺寸 1920*1080 ,做适配也就是在这个比例的基础上进行的
方案一:打开VSCode终端,下载flexible
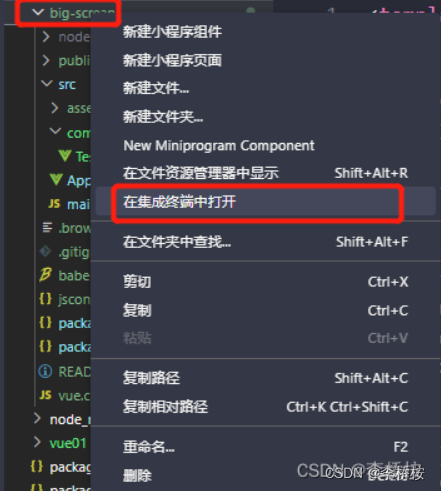
1、选中要运行的文件,右键–>【在集成终端中打开】,打开终端
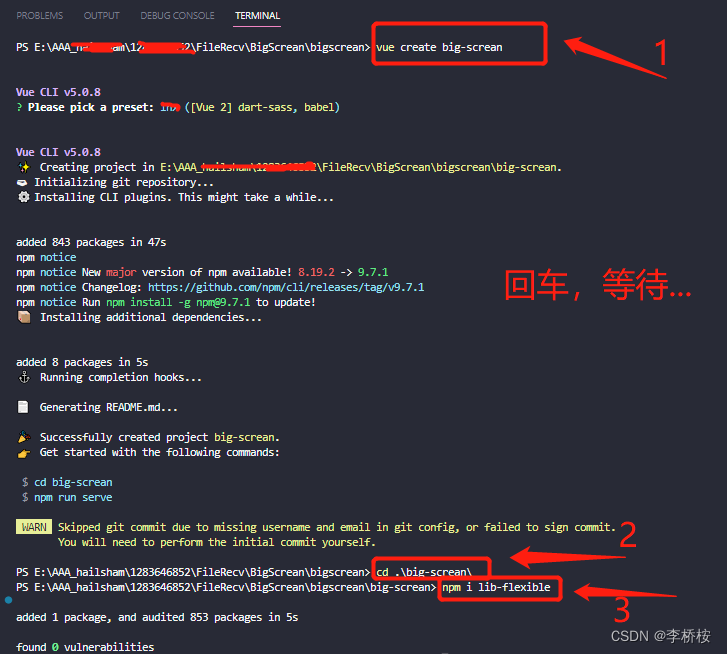
2、在终端输入npm i -g @vue/cli
npm i lib-flexible
修改源码
要修改的源码的路径: 项目/mode_modules/lib-flexible/flexible.js

// lefxible设计稿默认按540计算 我们不采取 我们采取设计稿宽度 1920
function refreshRem(){
    var width = docEl.getBoundingClientRect().width;
    if (width / dpr > 1920) {
        width = 1920 * dpr;
    }
    var rem = width / 24; /// 1920 / 24 = 80px 1rem = 80px
    docEl.style.fontSize = rem + 'px';
    flexible.rem = win.rem = rem;
}
项目中引用
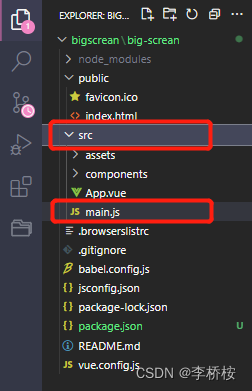
找到目录路径中 src/main.js文件
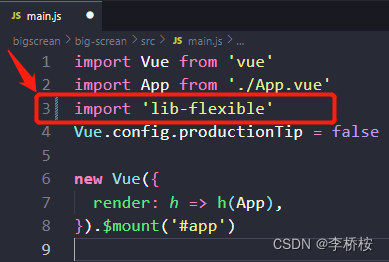
导入引用 import ‘lib-flexible’
配置插件—px to rem & rpx & vw(cssrem)
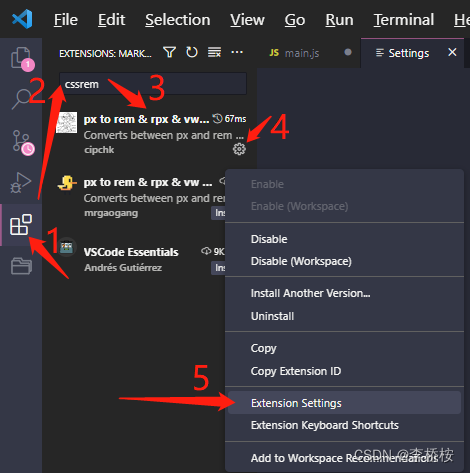
鼠标向下滑动找到Cssrem:Root Font Size选项,将值改成80(如下图)
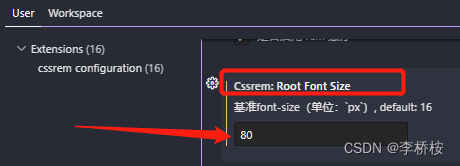
开发的时候使用单位:rem,即可;切记 1rem = 80px哦
二、可视化操作
可视化就是将数据用直观的方式展示,比单纯的文字看上去形象鲜活。
D3.js 非常棒的一款可视化工具库,就是难度较大。
Echarts.js 百度出品的,后来赠送给Apache,是免费开源的。
Highcharts.js 类似Echarts.js(相当于wps和office之间的关系)
AntV.js 蚂蚁金服 目前全新的一套可视化方案
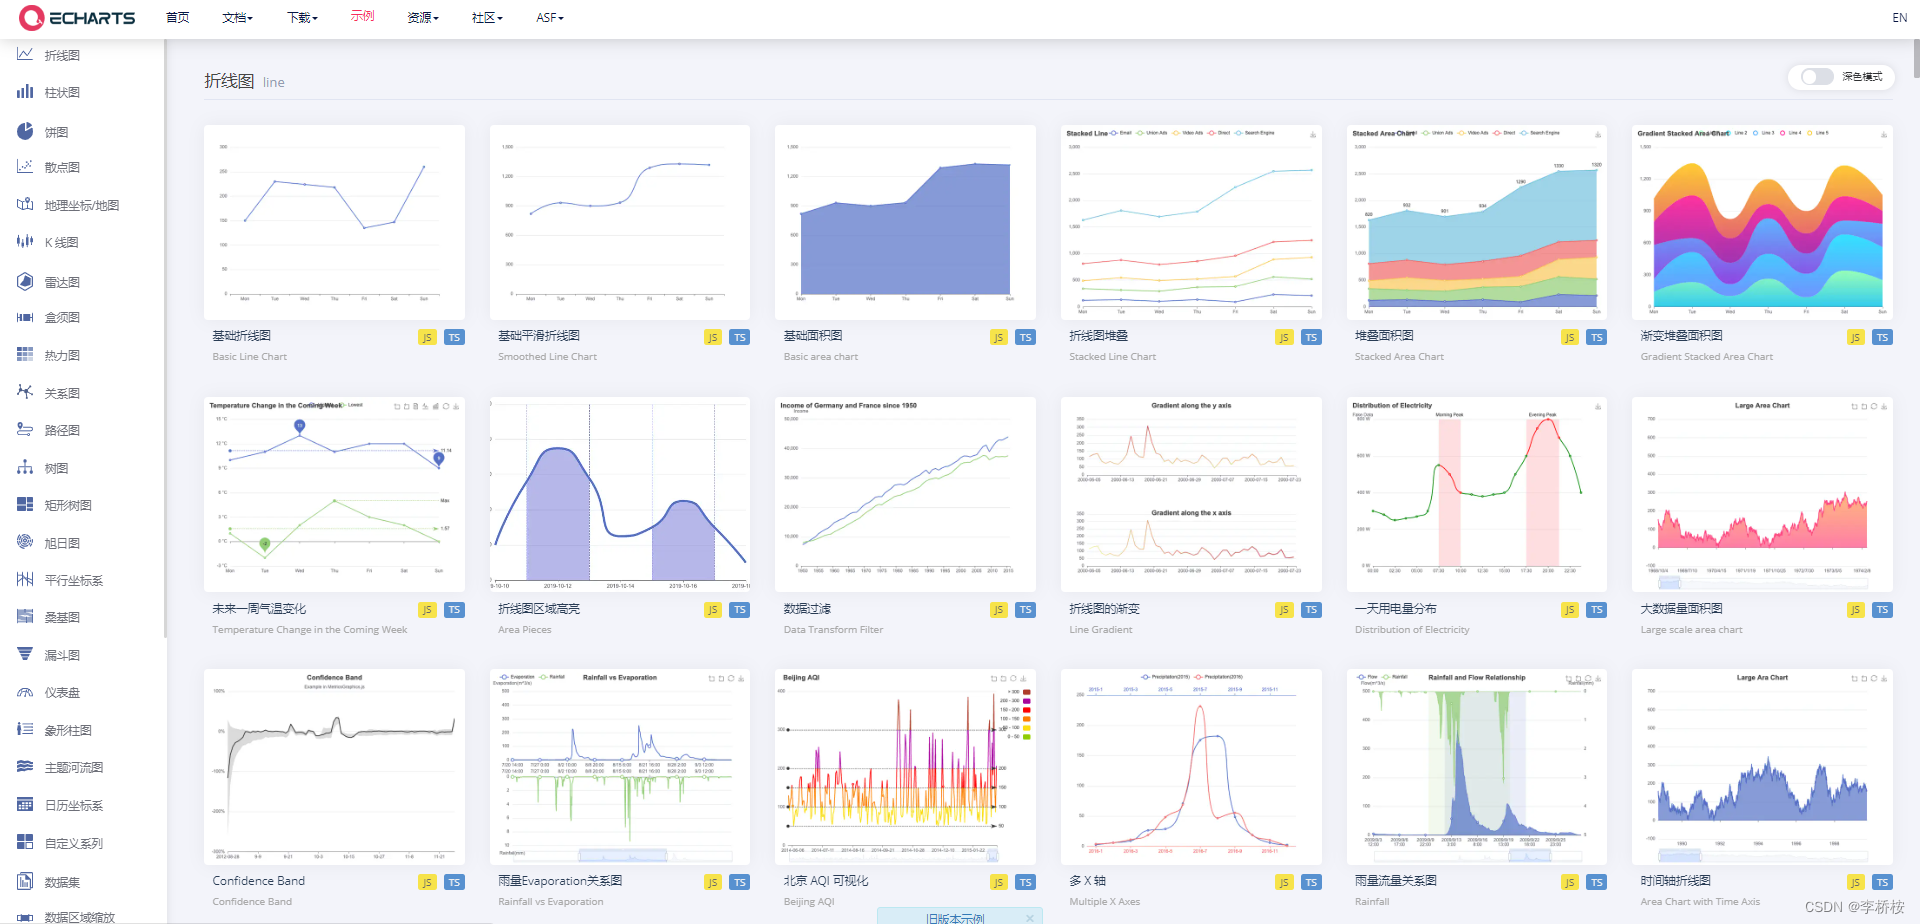
Apache ECharts官网链接Apache ECharts,官网示例如下
vue中使用echarts
在终端下载echarts
npm i echarts

导入echarts
import * as echarts from 'echarts'
定义容器
<div ref="echartsBox" class="echartsBox" style="width:400px;height:400px"></div>
初始化echarts
// 在生命周期 mounted中初始化
// this.echartsBox 需要在data重定义变量
this.echartsBox = echarts.init(this.$refs.echartsBox)
或
this.echartsBox = echarts.init(document.querySelecter("#id"))
参数说明
this.echartsBox = echarts.init(this.$refs.echartsBox,null,{width:111,height:222})
参数3可以配置初始化的canvas大小
定义配置变量
// 配置图表对象 渲染到页面中
// this.options在data中定义的
this.echartsBox.setOption(this.options)
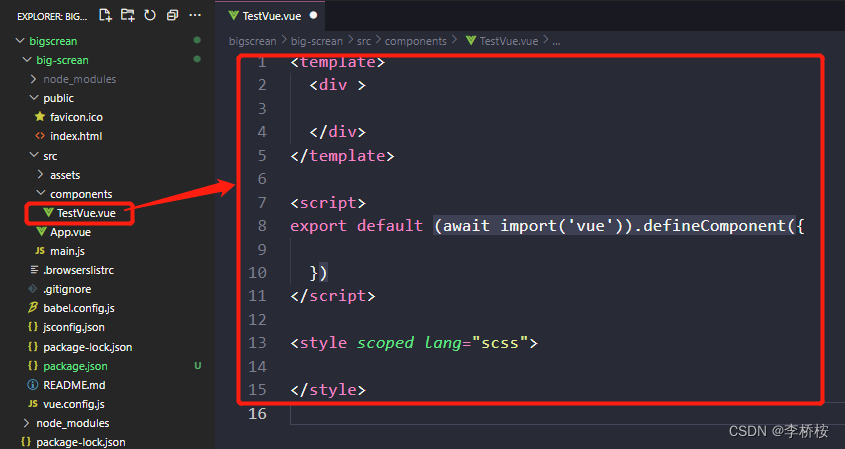
操作步骤:找到下图中的HelloWord.vue文件重命名为TestView.vue
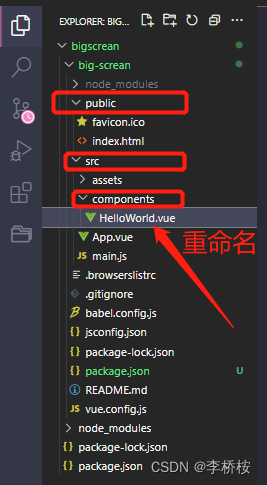

清空文件中自带的不必要源代码,并重新写入如下代码
<template>
  <div >

  </div>
</template>

<script>
export default {

  }
</script>

<style scoped lang="scss">

</style>
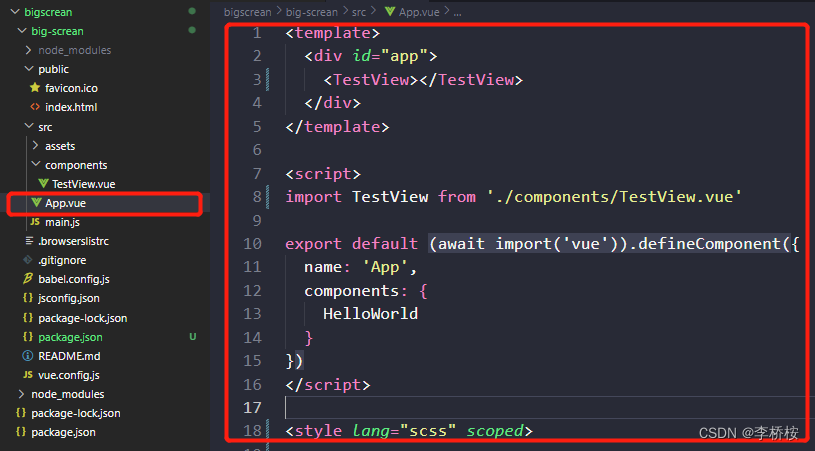
找到App.vue文件,清空文件中自带的不必要源代码,并重新写入如下代码
<template>
  <div id="app">
    <TestView></TestView>
  </div>
</template>

<script>
import TestView from './components/TestView.vue'

export default {
  name: 'App',
  components: {
    HelloWorld
  }
}
</script>
<style lang="scss" scoped>
</style>
然后在TestView.vue中导入echarts
import * as echarts from "echarts";
想拿到源文件直接运行,请移步至gzh【李桥桉】,s❤【大屏配置】。
在终端输入nmp run serve运行代码
nmp run serve
运行结果 若不会运行vue文件,请查看此文《vue运行方式》
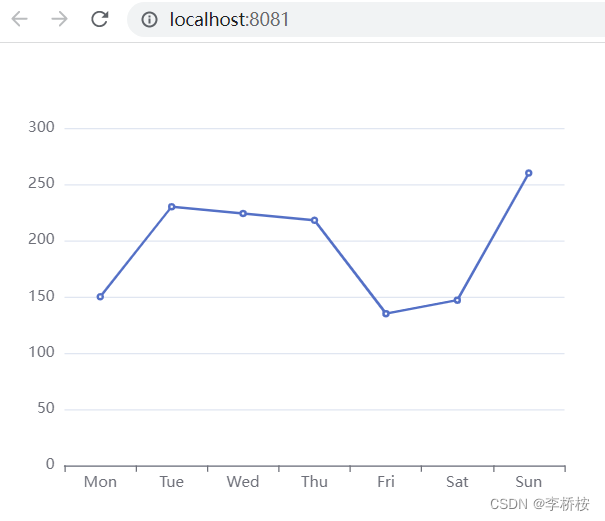
以上,基础部分就算完成了,大屏可视化无非就是多来几个图表。
TestView.vue源码如下:
<template>
  <div >
  <div class="box" ref="box"></div>
  </div>
</template>

<script>
//导入echarts
import * as echarts from "echarts";
export default {
  data(){
    return{
      myecharts:"",
      option: {
      xAxis: {
        type: 'category',
        data: ['Mon', 'Tue', 'Wed', 'Thu', 'Fri', 'Sat', 'Sun']
      },
      yAxis: {
        type: 'value'
      },
        series: [
          {
            data: [150, 230, 224, 218, 135, 147, 260],
            type: 'line'
          },
        ],
      },
    };
  },
  mounted(){
    this.myecharts = echarts.init(this.$refs.box);
    this.myecharts.setOption(this.option);
  },
}

</script>

<style scoped lang="scss">
  .box{
    width :500px;
    height:400px;
  }
</style>
App.vue源码如下:
<template>
  <div id="app">
    <TestView></TestView>
  </div>
</template>

<script>
import TestView from './components/TestView.vue'

export default {
  name: 'App',
  components: {
    TestView
  }
}
</script>

<style lang="scss" scoped>

</style>
附:常见的echarts
更改TestView.vue中的echart表格代码,可以更改任意图表,下面是一些其他图的代码
```css
折线图
option = {
  xAxis: { // echarts配置x轴
    type: 'category',
    data: ['Mon', 'Tue', 'Wed', 'Thu', 'Fri', 'Sat', 'Sun'] // x轴显示数据
  },
  yAxis: { // y轴配置
    type: 'value'
  },
  series: [ // 配置数据
    {
      data: [150, 230, 224, 218, 135, 147, 260],
      type: 'line' // 数据的显示方式 line折线
    }
  ]
};
柱形图
 {
    tooltip: {
          trigger: "axis",
          axisPointer: {
            type: "shadow",
          },
     },
     grid: {
          left: "3%",
          right: "4%",
          bottom: "3%",
          containLabel: true,
     },
     xAxis: [
          {
            type: "category",
            data: ["张三", "李四", "王五", "赵六", "田七", "孙八", "钱九"],
            axisTick: {
              alignWithLabel: true,
            },
          },
     ],
     yAxis: [
          {
            type: "value",
          },
     ],
     series: [
          {
            name: "成交量",
            type: "bar",
            barWidth: "60%",
            data: [10, 52, 20, 33, 39, 33, 22],
          },
     ],
}
饼图
{
   legend: {
      top: "bottom",
      textStyle: {
            color: "#fff",
      },
   },
  series: [
      {
            name: "Nightingale Chart",
            type: "pie",
            radius: [20, 150],
            center: ["50%", "50%"],
            roseType: "area",
            itemStyle: {
              borderRadius: 8,
       },
       data: [
              { value: 40, name: "成华区" },
              { value: 38, name: "金牛区" },
              { value: 32, name: "武侯区" },
              { value: 30, name: "青羊区" },
              { value: 28, name: "双流区" },
              { value: 26, name: "锦江区" },
            ],
        },
    ],
}
echarts关键属性

title 配置标题
legend 图示配置
textStyle 对象是配置颜色的
xAxis 折线图配置x轴
yAxis 折线图配置y轴
tooltip 鼠标悬停 显示图表信息
series 数据信息
color 图标颜色


未完待续,求关注,后续发布完整大屏可视化项目代码


 QT多线程的5种用法,通过使用线程解决UI主界面的耗时操作代码,防止界面卡死。...
 U8W/U8W-Mini使用与常见问题解决
 stm32使用HAL库配置串口中断收发数据(保姆级教程)
 分享几个国内免费的ChatGPT镜像网址(亲测有效)
 Allegro16.6差分等长设置及走线总结