您现在的位置是:首页 >技术交流 >5_普通最小二乘法线性回归案例(Scikit-learn 0.18.2)网站首页技术交流
5_普通最小二乘法线性回归案例(Scikit-learn 0.18.2)
简介5_普通最小二乘法线性回归案例(Scikit-learn 0.18.2)
-
现有一批描述家庭用电情况的数据,对数据进行算法模型预测,并最终得到预测模型(每天各个时间段和功率之间的关系、功率与电流之间的关系等)
- 数据来源:Individual household electric power consumption Data Set
- 建议:使用python的sklearn库的linear model中LinearRegression来获取算法
- 开发环境:https://scikit-learn.org/0.18/
# 引入所需要的全部包
from sklearn.model_selection import train_test_split # 数据划分的类
from sklearn.linear_model import LinearRegression # 线性回归的类
from sklearn.preprocessing import StandardScaler # 数据标准化

import numpy as np
import matplotlib as mpl
import matplotlib.pyplot as plt
import pandas as pd
from pandas import DataFrame
import time
## 设置字符集,防止中文乱码
mpl.rcParams['font.sans-serif']=[u'simHei']
mpl.rcParams['axes.unicode_minus']=False
# 加载数据
# 日期、时间、有功功率、无功功率、电压、电流、厨房用电功率、洗衣服用电功率、热水器用电功率
path1='datas/household_power_consumption_1000.txt'
df = pd.read_csv(path1, sep=';', low_memory=False)#没有混合类型的时候可以通过low_memory=F调用更多内存,加快效率)
df.head() ## 获取前五行数据查看查看
| Date | Time | Global_active_power | Global_reactive_power | Voltage | Global_intensity | Sub_metering_1 | Sub_metering_2 | Sub_metering_3 | |
|---|---|---|---|---|---|---|---|---|---|
| 0 | 16/12/2006 | 17:24:00 | 4.216 | 0.418 | 234.84 | 18.4 | 0.0 | 1.0 | 17.0 |
| 1 | 16/12/2006 | 17:25:00 | 5.360 | 0.436 | 233.63 | 23.0 | 0.0 | 1.0 | 16.0 |
| 2 | 16/12/2006 | 17:26:00 | 5.374 | 0.498 | 233.29 | 23.0 | 0.0 | 2.0 | 17.0 |
| 3 | 16/12/2006 | 17:27:00 | 5.388 | 0.502 | 233.74 | 23.0 | 0.0 | 1.0 | 17.0 |
| 4 | 16/12/2006 | 17:28:00 | 3.666 | 0.528 | 235.68 | 15.8 | 0.0 | 1.0 | 17.0 |
# 查看格式信息
df.info()
<class 'pandas.core.frame.DataFrame'>
RangeIndex: 1000 entries, 0 to 999
Data columns (total 9 columns):
Date                     1000 non-null object
Time                     1000 non-null object
Global_active_power      1000 non-null float64
Global_reactive_power    1000 non-null float64
Voltage                  1000 non-null float64
Global_intensity         1000 non-null float64
Sub_metering_1           1000 non-null float64
Sub_metering_2           1000 non-null float64
Sub_metering_3           1000 non-null float64
dtypes: float64(7), object(2)
memory usage: 70.4+ KB
# 异常数据处理(异常数据过滤)
new_df = df.replace('?', np.nan)#替换非法字符为np.nan
datas = new_df.dropna(axis=0, how = 'any') # 只要有一个数据为空,就进行行删除操作
datas.describe().T#观察数据的多种统计指标(只能看数值型的)
| count | mean | std | min | 25% | 50% | 75% | max | |
|---|---|---|---|---|---|---|---|---|
| Global_active_power | 1000.0 | 2.418772 | 1.239979 | 0.206 | 1.806 | 2.414 | 3.308 | 7.706 |
| Global_reactive_power | 1000.0 | 0.089232 | 0.088088 | 0.000 | 0.000 | 0.072 | 0.126 | 0.528 |
| Voltage | 1000.0 | 240.035790 | 4.084420 | 230.980 | 236.940 | 240.650 | 243.295 | 249.370 |
| Global_intensity | 1000.0 | 10.351000 | 5.122214 | 0.800 | 8.400 | 10.000 | 14.000 | 33.200 |
| Sub_metering_1 | 1000.0 | 0.000000 | 0.000000 | 0.000 | 0.000 | 0.000 | 0.000 | 0.000 |
| Sub_metering_2 | 1000.0 | 2.749000 | 8.104053 | 0.000 | 0.000 | 0.000 | 1.000 | 38.000 |
| Sub_metering_3 | 1000.0 | 5.756000 | 8.066941 | 0.000 | 0.000 | 0.000 | 17.000 | 19.000 |
# 查看格式信息
df.info()
<class 'pandas.core.frame.DataFrame'>
RangeIndex: 1000 entries, 0 to 999
Data columns (total 9 columns):
Date                     1000 non-null object
Time                     1000 non-null object
Global_active_power      1000 non-null float64
Global_reactive_power    1000 non-null float64
Voltage                  1000 non-null float64
Global_intensity         1000 non-null float64
Sub_metering_1           1000 non-null float64
Sub_metering_2           1000 non-null float64
Sub_metering_3           1000 non-null float64
dtypes: float64(7), object(2)
memory usage: 70.4+ KB
## 创建一个时间函数格式化字符串
def date_format(dt):
    # dt显示是一个series/tuple;dt[0]是date,dt[1]是time
    import time
    t = time.strptime(' '.join(dt), '%d/%m/%Y %H:%M:%S')
    return (t.tm_year, t.tm_mon, t.tm_mday, t.tm_hour, t.tm_min, t.tm_sec)
## 需求:构建时间和功率之间的映射关系,可以认为:特征属性为时间;目标属性为功率值。
# 获取x和y变量, 并将时间转换为数值型连续变量
X = datas.iloc[:,0:2]
X = X.apply(lambda x: pd.Series(date_format(x)), axis=1)
Y = datas['Global_active_power']
X.head(2)
| 0 | 1 | 2 | 3 | 4 | 5 | |
|---|---|---|---|---|---|---|
| 0 | 2006 | 12 | 16 | 17 | 24 | 0 |
| 1 | 2006 | 12 | 16 | 17 | 25 | 0 |
## 对数据集进行测试集合训练集划分
# X:特征矩阵(类型一般是DataFrame)
# Y:特征对应的Label标签(类型一般是Series)
# test_size: 对X/Y进行划分的时候,测试集合的数据占比, 是一个(0,1)之间的float类型的值
# random_state: 数据分割是基于随机器进行分割的,该参数给定随机数种子;给一个值(int类型)的作用就是保证每次分割所产生的数数据集是完全相同的
X_train,X_test,Y_train,Y_test = train_test_split(X, Y, test_size=0.2, random_state=0)
print(X_train.shape)
print(X_test.shape)
print(Y_train.shape)
(800, 6)
(200, 6)
(800,)
# 查看训练集上的数据信息(X)
X_train.describe()
## 数据标准化
# StandardScaler:将数据转换为标准差为1的数据集(有一个数据的映射)
# scikit-learn中:如果一个API名字有fit,那么就有模型训练的含义,没法返回值
# scikit-learn中:如果一个API名字中有transform, 那么就表示对数据具有转换的含义操作
# scikit-learn中:如果一个API名字中有predict,那么就表示进行数据预测,会有一个预测结果输出
# scikit-learn中:如果一个API名字中既有fit又有transform的情况下,那就是两者的结合(先做fit,再做transform)
ss = StandardScaler() # 模型对象创建
X_train = ss.fit_transform(X_train) # 训练模型并转换训练集
X_test = ss.transform(X_test) ## 直接使用在模型构建数据上进行一个数据标准化操作 (测试集)
pd.DataFrame(X_train).describe()
| 0 | 1 | 2 | 3 | 4 | 5 | |
|---|---|---|---|---|---|---|
| count | 800.0 | 800.0 | 8.000000e+02 | 8.000000e+02 | 8.000000e+02 | 800.0 |
| mean | 0.0 | 0.0 | 2.445821e-15 | -8.604228e-17 | 8.104628e-17 | 0.0 |
| std | 0.0 | 0.0 | 1.000626e+00 | 1.000626e+00 | 1.000626e+00 | 0.0 |
| min | 0.0 | 0.0 | -1.221561e+00 | -1.333814e+00 | -1.722545e+00 | 0.0 |
| 25% | 0.0 | 0.0 | -1.221561e+00 | -8.377420e-01 | -8.532677e-01 | 0.0 |
| 50% | 0.0 | 0.0 | 8.186245e-01 | -3.416698e-01 | 1.600918e-02 | 0.0 |
| 75% | 0.0 | 0.0 | 8.186245e-01 | 1.022529e+00 | 8.852861e-01 | 0.0 |
| max | 0.0 | 0.0 | 8.186245e-01 | 1.518601e+00 | 1.696611e+00 | 0.0 |
## 模型训练
lr = LinearRegression(fit_intercept=True) # 模型对象构建
lr.fit(X_train, Y_train) ## 训练模型
## 模型校验
y_predict = lr.predict(X_test) ## 预测结果

print("训练集上R2:",lr.score(X_train, Y_train))
print("测试集上R2:",lr.score(X_test, Y_test))
mse = np.average((y_predict-Y_test)**2)
rmse = np.sqrt(mse)
print("rmse:",rmse)
训练集上R2: 0.24409311805909026
测试集上R2: 0.12551628513735869
rmse: 1.1640923459736248
# 输出模型训练得到的相关参数
print("模型的系数(θ):", end="")
print(lr.coef_)
print("模型的截距:", end='')
print(lr.intercept_)
模型的系数(θ):[ 0.00000000e+00 -6.66133815e-16 -1.41588166e+00 -9.34953243e-01
 -1.02140756e-01  0.00000000e+00]
模型的截距:2.4454375000000033
## 模型保存/持久化
# 在机器学习部署的时候,实际上其中一种方式就是将模型进行输出;另外一种方式就是直接将预测结果输出
# 模型输出一般是将模型输出到磁盘文件
from sklearn.externals import joblib

# 保存模型要求给定的文件所在的文件夹必须存在
joblib.dump(ss, "result/data_ss.model") ## 将标准化模型保存
joblib.dump(lr, "result/data_lr.model") ## 将模型保存
# 加载模型
ss3 = joblib.load("result/data_ss.model") ## 加载模型
lr3 = joblib.load("result/data_lr.model") ## 加载模型

# 使用加载的模型进行预测
data1 = [[2006, 12, 17, 12, 25, 0]]
data1 = ss3.transform(data1)
print(data1)
lr3.predict(data1)
[[ 0.          0.          0.81862454  0.15440249 -0.27374978  0.        ]]


array([1.16996393])
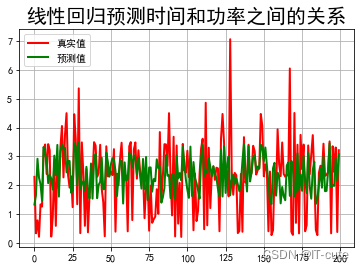
## 预测值和实际值画图比较
t=np.arange(len(X_test))
plt.figure(facecolor='w')#建一个画布,facecolor是背景色
plt.plot(t, Y_test, 'r-', linewidth=2, label='真实值')
plt.plot(t, y_predict, 'g-', linewidth=2, label='预测值')
plt.legend(loc = 'upper left')#显示图例,设置图例的位置
plt.title("线性回归预测时间和功率之间的关系", fontsize=20)
plt.grid(b=True)#加网格
plt.show()

## 功率和电流之间的关系
X = datas.iloc[:,2:4]
Y2 = datas.iloc[:,5]

## 数据分割
X2_train,X2_test,Y2_train,Y2_test = train_test_split(X, Y2, test_size=0.2, random_state=0)

## 数据归一化
scaler2 = StandardScaler()
X2_train = scaler2.fit_transform(X2_train) # 训练并转换
X2_test = scaler2.transform(X2_test) ## 直接使用在模型构建数据上进行一个数据标准化操作

## 模型训练
lr2 = LinearRegression()
lr2.fit(X2_train, Y2_train) ## 训练模型

## 结果预测
Y2_predict = lr2.predict(X2_test)

## 模型评估
print("电流预测准确率: ", lr2.score(X2_test,Y2_test))
print("电流参数:", lr2.coef_)

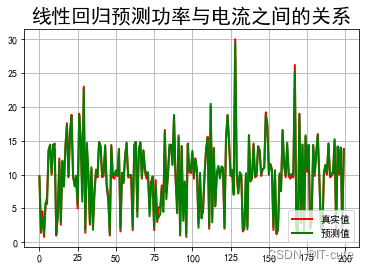
## 绘制图表
#### 电流关系
t=np.arange(len(X2_test))
plt.figure(facecolor='w')
plt.plot(t, Y2_test, 'r-', linewidth=2, label=u'真实值')
plt.plot(t, Y2_predict, 'g-', linewidth=2, label=u'预测值')
plt.legend(loc = 'lower right')
plt.title(u"线性回归预测功率与电流之间的关系", fontsize=20)
plt.grid(b=True)
plt.show()
电流预测准确率:  0.9920420609708968
电流参数: [5.07744316 0.07191391]

风语者!平时喜欢研究各种技术,目前在从事后端开发工作,热爱生活、热爱工作。


 U8W/U8W-Mini使用与常见问题解决
 QT多线程的5种用法,通过使用线程解决UI主界面的耗时操作代码,防止界面卡死。...
 stm32使用HAL库配置串口中断收发数据(保姆级教程)
 分享几个国内免费的ChatGPT镜像网址(亲测有效)
 Allegro16.6差分等长设置及走线总结