您现在的位置是:首页 >技术杂谈 >Python plt; ax 设置tick网站首页技术杂谈
Python plt; ax 设置tick
Python中绘图可以基于plt;也可基于ax
在 Matplotlib 中,Axes 对象(常简写为 ax)是在图(Figure)中进行大部分的绘图操作的地方。一个 Axes 对象代表了一个具体的绘图区域。
利用 plt 绘图
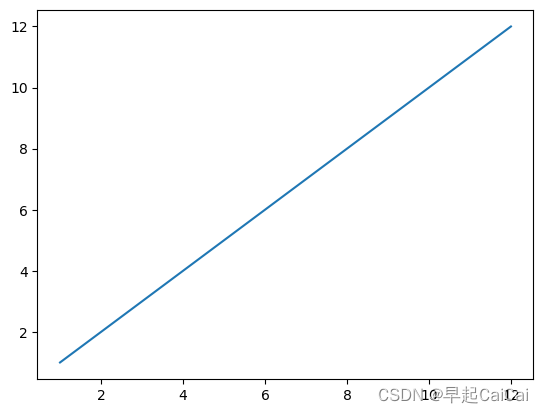
简单的图像测试;
import numpy as np
import matplotlib.pyplot as plt
x = range(1,13,1)
y = range(1,13,1)
plt.plot(x,y)
plt.show()

在locs决定的位置上虽然会画出ticks,但不会显示任何值。
plt.plot(x,y)
plt.xticks(x,())
设置其他的tick
plt.plot(x,y)
plt.xticks(x, ('Tom','Dick','Harry','Sally','Sue','Lily','Ava','Isla','Rose','Jack','Leo','Charlie'))
例如显示月份:
import numpy as np
import matplotlib.pyplot as plt
import calendar
x = range(1,13,1)
y = range(1,13,1)
plt.plot(x,y)
plt.xticks(x, calendar.month_name[1:13],color='blue',rotation=60)
plt.show()

若月份简写的话,可设置
plt.plot(x,y)
plt.xticks(x, calendar.month_abbr[1:13],color='blue',rotation=60)
若设置tick 与 tick-label 均不显示
plt.plot(x,y)
plt.xticks([])
ax 设置tick的位置
改变tick的位置
import matplotlib.pyplot as plt

x = [1, 2, 3, 4, 5]
y = [2, 3, 5, 7, 11]

fig, ax = plt.subplots()
ax.plot(x, y)
ax.xaxis.tick_top()
ax.yaxis.tick_right()
plt.show()

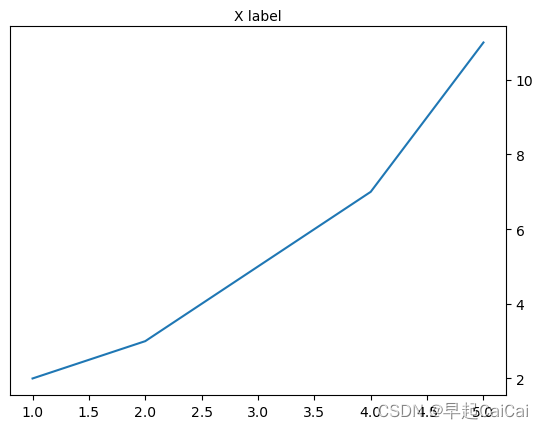
只更改轴名称的位置
import matplotlib.pyplot as plt

x = [1, 2, 3, 4, 5]
y = [2, 3, 5, 7, 11]

fig, ax = plt.subplots()
ax.plot(x, y)
ax.set_xlabel('X label')
ax.xaxis.set_label_position('top')
ax.yaxis.tick_right()
plt.show()

解释代码:
这段代码创建了一个基本的折线图,并将x轴标签移到了顶部,y轴的刻度移到了右侧。
-
import matplotlib.pyplot as plt:这行导入了matplotlib库的pyplot模块,并将其命名为plt。matplotlib是Python的一个主要的绘图库,而pyplot是matplotlib的一个模块,提供了MATLAB风格的接口来创建图形。 -
x = [1, 2, 3, 4, 5]; y = [2, 3, 5, 7, 11]:这两行定义了我们想要在图形中表示的数据。 -
fig, ax = plt.subplots():这行创建了一个新的图形(Figure)和一个新的坐标轴(Axes)。Figure是matplotlib中的最高级别的容器,表示了整个窗口或者页面。Axes则是一个具体的绘图区域,包含了两个(或三个)坐标轴。 -
ax.plot(x, y):这行在坐标轴上绘制了一条折线图,表示了x和y的关系。 -
ax.set_xlabel('X label'):这行设置了x轴的标签。 -
ax.xaxis.set_label_position('top'):这行将x轴的标签位置设置为顶部。 -
ax.yaxis.tick_right():这行将y轴的刻度位置设置为右侧。
Reference
python_matplotlib改变横坐标和纵坐标上的刻度(ticks)
Python seaborn heatmap及其heatmap将刻度标记放置在图像的顶部


 QT多线程的5种用法,通过使用线程解决UI主界面的耗时操作代码,防止界面卡死。...
 U8W/U8W-Mini使用与常见问题解决
 stm32使用HAL库配置串口中断收发数据(保姆级教程)
 分享几个国内免费的ChatGPT镜像网址(亲测有效)
 Allegro16.6差分等长设置及走线总结