您现在的位置是:首页 >技术交流 >Echarts 在 Vue 中的最佳实践网站首页技术交流
Echarts 在 Vue 中的最佳实践
前言
相信对于大对数人来说,ECharts 这玩意儿都是一个很容易上手的东西,就算你不是开发人员,只要到 ECahrts 的官网 上找几个例子看一下也能很快掌握它。
但是能用不代表用得好,因为工作中看过太多的图表使用既重复又混乱,所以决定用这篇文章分享一下我在工作中对 Ecahrts 使用的一个最佳实践。
1. 基础 ECharts 示例回顾
首先,我们先来回顾一下在 html 中一个最基础的 ECharts 图表是如何显示的
- 通过
cdn引入ecahrts
<script
  type="text/javascript"
  src="https://fastly.jsdelivr.net/npm/echarts@5.4.1/dist/echarts.min.js"
></script>
- 创建一个用于显示图表的
dom元素容器
<div id="container" style="width: 1000px; height: 500px"></div>
要注意这个容器一定要标注宽高
- 获取这个
dom的js对象
var dom = document.getElementById("container");
- 初始化
echarts实例
var myChart = echarts.init(dom, 'light', {
    renderer: "canvas"
});
setOption设置配置项
myChart.setOption({
  xAxis: {
    type: "category",
    data: ["Mon", "Tue", "Wed", "Thu", "Fri", "Sat", "Sun"],
  },
  yAxis: {
    type: "value",
  },
  series: [
    {
      data: [150, 230, 224, 218, 135, 147, 260],
      type: "line",
    },
  ],
});
最终的效果如下:

2. Vue2 + ECharts
目录结构:
├─Echarts
|  └─ mixins
|     debounce.js   // 防抖工具函数
|     resize.js     // 混入 resize
|  |
│  └─src             // 存放封装的组件
│     BaseEchart.vue  基础组件
│     BarEchart.vue   基于 BaseEchart 二次封装的柱状图
│     PieEchart.vue   基于 BaseEchart 二次封装的饼图
|     LineEchart.vue  基于 BaseEchart 二次封装的折线图
|  index.js  // 统一导出所有封装的组件
2.1 基础 v1 版本
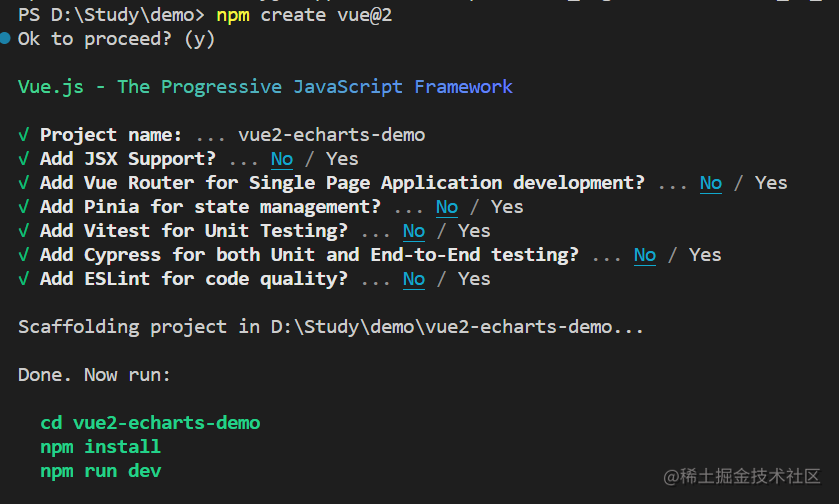
- 我们先通过
vue create命令创建一个vue2项目
npm create vue@2

- 安装
echarts
npm install echarts --save
- 创建
src/components/ECharts/src/BaseEchart.vue
<template>
  <div
    id="base-echart"
    class="base-echart"
    style="width: 1000px; height: 500px"
  ></div>
</template>

<script>
import * as echarts from "echarts";

export default {
  data() {
    return {
      chart: null,
    };
  },
  mounted() {
    this.initChart();
  },
  methods: {
    initChart() {
      this.chart = echarts.init(document.getElementById("base-echart"));

      this.chart.setOption({
        xAxis: {
          type: "category",
          data: ["Mon", "Tue", "Wed", "Thu", "Fri", "Sat", "Sun"],
        },
        yAxis: {
          type: "value",
        },
        series: [
          {
            data: [150, 230, 224, 218, 135, 147, 260],
            type: "line",
          },
        ],
      });
    },
  },
};
</script>

<style scoped></style>
- 删除
App.vue中多余的东西,引入BaseEcahrt组件
<template>
  <div id="app">
    <base-echart />
  </div>
</template>

<script>
import BaseEchart from "./components/ECharts/src/BaseEchart.vue";

export default {
  components: {
    BaseEchart,
  },
};
</script>

<style scoped></style>
至此,我们已经可以成功在 vue2 项目中显示一个 echarts 图表了,但是现在的做法有很多问题需要我们解决,比如:
- 我们在
mounted实例化了chart,但是没有在组件销毁前销毁chart(性能优化) - 当前的一些属性都是定死的
id、class、style,option等等(我们希望一个组件是可以高度定制的) - 当我们设置宽高是百分比时,希望他们随着浏览器窗口的改变而重新分配一下大小(窗口改变重置大小)
- …
2.2 添加 props & 实例销毁 v2 版本
- 修改
src/components/Echarts/src/BaseEchart.vue
<template>
  <div
    :id="id"
    :class="className"
    :style="{ height: height, width: width }"
  ></div>
</template>

<script>
import * as echarts from "echarts";

export default {
  props: {
    className: {
      type: String,
      default: "base-echart",
    },
    id: {
      type: String,
      default: "base-echart",
    },
    width: {
      type: String,
      default: "600px",
    },
    height: {
      type: String,
      default: "300px",
    },
  },
  data() {
    return {
      chart: null,
    };
  },
  mounted() {
    this.initChart();
  },
  beforeDestroy() {
    if (!this.chart) {
      return;
    }
    this.chart.dispose();
    this.chart = null;
  },
  methods: {
    initChart() {
      this.chart = echarts.init(document.getElementById(this.id));

      this.chart.setOption({
        xAxis: {
          type: "category",
          data: ["Mon", "Tue", "Wed", "Thu", "Fri", "Sat", "Sun"],
        },
        yAxis: {
          type: "value",
        },
        series: [
          {
            data: [150, 230, 224, 218, 135, 147, 260],
            type: "line",
          },
        ],
      });
    },
  },
};
</script>

<style scoped></style>
在上面的代码中我们在 beforeDestroy 生命周期中添加了对 chart 实例的销毁 对 id class style 等属性都添加了 prop,他们都有默认的值,使用时可以通过修改他们来改变大小
如:
<base-echart id="app-echart" class="app-echart" width="100vw" height="100vh"/>
2.3 添加 resize 混入 v3 版本
vue2 给我们提供了一个 mixins 选项来支持我们混入的数据和方法,我们可以利用这个选项来混入 resize 的逻辑
- 创建
src/components/ECharts/mixins/resize.js
import { debounce } from "./debounce.js";

export default {
  data() {
    return {
      $_resizeHandler: null,
    };
  },
  mounted() {
    this.initListener();
  },
  activated() {
    if (!this.$_resizeHandler) {
      // 避免重复初始化
      this.initListener();
    }

    // 激活保活图表时,自动调整大小
    this.resize();
  },
  beforeDestroy() {
    this.destroyListener();
  },
  deactivated() {
    this.destroyListener();
  },
  methods: {
    // 使用 $_ 作为一个私有 property 的约定,以确保不会和 Vue 自身相冲突。
    // 详情参见 vue 风格指南 https://vuejs.org/v2/style-guide/index.html#Private-property-names-essential

    initListener() {
      this.$_resizeHandler = debounce(() => {
        this.resize();
      }, 100);
      window.addEventListener("resize", this.$_resizeHandler);
    },
    destroyListener() {
      window.removeEventListener("resize", this.$_resizeHandler);
      this.$_resizeHandler = null;
    },
    resize() {
      const { chart } = this;
      chart && chart.resize();
    },
  },
};
在上面的代码中我们分别在 mounted、activated 两个生命周期中添加了对 window 的 resize 事件的监听,在 beforeDestroy、deactivated 事件中销毁这个 resize 的监听事件。而 resize 重置图表大小的方法可以直接调用 chart 实例上的 resize 方法。
- 创建
src/components/ECharts/mixins/debounce.js
/**
 * @param {Function} func
 * @param {number} wait
 * @param {boolean} immediate
 * @return {*}
 */
export function debounce(func, wait, immediate) {
  let timeout, args, context, timestamp, result;

  const later = function () {
    // 据上一次触发时间间隔
    const last = +new Date() - timestamp;

    // 上次被包装函数被调用时间间隔 last 小于设定时间间隔 wait
    if (last < wait && last > 0) {
      timeout = setTimeout(later, wait - last);
    } else {
      timeout = null;
      // 如果设定为immediate===true,因为开始边界已经调用过了此处无需调用
      if (!immediate) {
        result = func.apply(context, args);
        if (!timeout) context = args = null;
      }
    }
  };

  return function (...args) {
    context = this;
    timestamp = +new Date();
    const callNow = immediate && !timeout;
    // 如果延时不存在,重新设定延时
    if (!timeout) timeout = setTimeout(later, wait);
    if (callNow) {
      result = func.apply(context, args);
      context = args = null;
    }

    return result;
  };
}
debounce.js 中导出一个 debounce 防抖的工具函数,如果你们的项目中已有 debounce 函数,可选择引入已有的
- 测试:改变浏览器窗口实现图表大小自适应
2.4 自定义 option v4 版本
现在的 BaseEchart 组件,添加 option prop 使其支持样式可配置
- 修改
src/components/ECharts/src/BaseEChart.vue
<template>
  <div
    :id="id"
    :class="className"
    :style="{ height: height, width: width }"
  ></div>
</template>

<script>
import * as echarts from "echarts";
import reszie from "../mixins/resize";
export default {
  mixins: [reszie],
  props: {
    className: {
      type: String,
      default: "base-echart",
    },
    id: {
      type: String,
      default: "base-echart",
    },
    width: {
      type: String,
      default: "600px",
    },
    height: {
      type: String,
      default: "300px",
    },
    option: {
      type: Object,
      required: true,
    },
  },
  data() {
    return {
      chart: null,
    };
  },
  watch: {
    option() {
      this.initChart();
    },
  },
  mounted() {
    this.initChart();
  },
  beforeDestroy() {
    if (!this.chart) {
      return;
    }
    this.chart.dispose();
    this.chart = null;
  },
  methods: {
    initChart() {
      this.chart = echarts.init(document.getElementById(this.id));

      this.chart.setOption(this.option);
    },
  },
};
</script>

<style scoped></style>
在上面的代码中我们添加了 option prop,并且 watch 监听 option 的变化重新初始化图表,现在我们就可以自由的配置任何图表
- 创建
src/components/ECharts/src/LineEchart.vue
<template>
  <base-echart
    id="line-echart"
    class="line-echart"
    width="100vw"
    height="100vh"
    :option="option"
  />
</template>

<script>
import BaseEchart from "./BaseEchart.vue";

export default {
  components: {
    BaseEchart,
  },
  data() {
    return {
      option: {
        xAxis: {
          type: "category",
          data: ["Mon", "Tue", "Wed", "Thu", "Fri", "Sat", "Sun"],
        },
        yAxis: {
          type: "value",
        },
        series: [
          {
            data: [150, 230, 224, 218, 135, 147, 260],
            type: "line",
          },
        ],
      },
    };
  },
  mounted() {
    setTimeout(() => {
      this.option = {
        xAxis: {
          type: "category",
          boundaryGap: false,
          data: ["Mon", "Tue", "Wed", "Thu", "Fri", "Sat", "Sun"],
        },
        yAxis: {
          type: "value",
        },
        series: [
          {
            data: [820, 932, 901, 934, 1290, 1330, 1320],
            type: "line",
            areaStyle: {},
          },
        ],
      };
    }, 3000);
  },
};
</script>

<style scoped></style>
- 创建
src/components/ECharts/src/BarEChart.vue
<template>
  <base-echart
    id="bar-echart"
    class="bar-echart"
    width="400px"
    height="200px"
    :option="option"
  />
</template>

<script>
import BaseEchart from "./src/BaseEchart.vue";

export default {
  components: {
    BaseEchart,
  },
  data() {
    return {
      option: {
        xAxis: {
          type: "category",
          data: ["Mon", "Tue", "Wed", "Thu", "Fri", "Sat", "Sun"],
        },
        yAxis: {
          type: "value",
        },
        series: [
          {
            data: [120, 200, 150, 80, 70, 110, 130],
            type: "bar",
            showBackground: true,
            backgroundStyle: {
              color: "rgba(180, 180, 180, 0.2)",
            },
          },
        ],
      },
    };
  },
  mounted() {
    setTimeout(() => {
      this.option = {
        title: {
          text: "World Population",
        },
        tooltip: {
          trigger: "axis",
          axisPointer: {
            type: "shadow",
          },
        },
        legend: {},
        grid: {
          left: "3%",
          right: "4%",
          bottom: "3%",
          containLabel: true,
        },
        xAxis: {
          type: "value",
          boundaryGap: [0, 0.01],
        },
        yAxis: {
          type: "category",
          data: ["Brazil", "Indonesia", "USA", "India", "China", "World"],
        },
        series: [
          {
            name: "2011",
            type: "bar",
            data: [18203, 23489, 29034, 104970, 131744, 630230],
          },
          {
            name: "2012",
            type: "bar",
            data: [19325, 23438, 31000, 121594, 134141, 681807],
          },
        ],
      };
    }, 3000);
  },
};
</script>

<style scoped></style>
- 创建
src/components/ECharts/src/PieEchart.vue
<template>
  <base-echart
    id="pie-echart"
    class="pie-echart"
    width="400px"
    height="400px"
    :option="option"
  />
</template>

<script>
import BaseEchart from "./BaseEchart.vue";

export default {
  components: {
    BaseEchart,
  },
  data() {
    return {
      option: {
        tooltip: {
          trigger: "item",
        },
        legend: {
          top: "5%",
          left: "center",
        },
        series: [
          {
            name: "Access From",
            type: "pie",
            radius: ["40%", "70%"],
            avoidLabelOverlap: false,
            itemStyle: {
              borderRadius: 10,
              borderColor: "#fff",
              borderWidth: 2,
            },
            label: {
              show: false,
              position: "center",
            },
            emphasis: {
              label: {
                show: true,
                fontSize: 40,
                fontWeight: "bold",
              },
            },
            labelLine: {
              show: false,
            },
            data: [
              { value: 1048, name: "Search Engine" },
              { value: 735, name: "Direct" },
              { value: 580, name: "Email" },
              { value: 484, name: "Union Ads" },
              { value: 300, name: "Video Ads" },
            ],
          },
        ],
      },
    };
  },
  mounted() {
    setTimeout(() => {
      this.option = {
        tooltip: {
          trigger: "item",
        },
        legend: {
          top: "5%",
          left: "center",
          // doesn't perfectly work with our tricks, disable it
          selectedMode: false,
        },
        series: [
          {
            name: "Access From",
            type: "pie",
            radius: ["40%", "70%"],
            center: ["50%", "70%"],
            // adjust the start angle
            startAngle: 180,
            label: {
              show: true,
              formatter(param) {
                // correct the percentage
                return param.name + " (" + param.percent * 2 + "%)";
              },
            },
            data: [
              { value: 1048, name: "Search Engine" },
              { value: 735, name: "Direct" },
              { value: 580, name: "Email" },
              { value: 484, name: "Union Ads" },
              { value: 300, name: "Video Ads" },
              {
                // make an record to fill the bottom 50%
                value: 1048 + 735 + 580 + 484 + 300,
                itemStyle: {
                  // stop the chart from rendering this piece
                  color: "none",
                  decal: {
                    symbol: "none",
                  },
                },
                label: {
                  show: false,
                },
              },
            ],
          },
        ],
      };
    }, 3000);
  },
};
</script>
<style scoped></style>
在以上的代码中,我们分别创建了三种类型的图表组件,BarEchart 柱状图、LineEchart 折线图、PieEchart 饼图,并且在三秒钟之后修改了他们的配置
- 创建
src/components/ECharts/index.js在这个文件中集体导出所有图表组件
import BaseEchart from "./src/BarEchart.vue";
import LineEchart from "./src/LineEchart.vue";
import BarEchart from "./src/BarEchart.vue";
import PieEchart from "./src/PieEchart.vue";

export { BaseEchart, LineEchart, BarEchart, PieEchart };
- 测试,修改
App.vue
<template>
  <div id="app">
    <line-echart />
    <pie-echart />
    <bar-echart />
  </div>
</template>

<script>
import { LineEchart, PieEchart, BarEchart } from "./components/ECharts";

export default {
  components: {
    LineEchart,
    PieEchart,
    BarEchart,
  },
};
</script>

<style scoped>
#app {
  padding: 0;
  margin: 0;
  width: 100vw;
  height: 100vh;
  background-color: #fff;
}
</style>
最终效果:

2.5 总结
在这一章中:
- 我们封装了一个
BaseEchart作为基础的图表组件 - 通过提供
id、class、option等等的prop来实现图表的高度自定义 - 封装了一个
resize.js文件用来实现当浏览器窗口大小改变时重置图表的大小。并且通过防抖函数控制resize事件的触发次数达到了性能优化的目的。 - 在
BaseEchart的基础上又封装了三种不同类型的组件LineEchartPieEchartBarEchart,通过改变option来控制图表的样式,在这些二次封装的组件还可以做一些数据的处理,因为实际项目中我们的option不可能是写死的。 - 最终的目录结构与逻辑以及使用方式都十分简单清晰,后续如果还有不同的需求,可以直接在
BaseEchart的基础上继续封装,只需要控制传入的option即可。

有了在 vue2 中封装的基础,在 vue3 也是差不多的思路,下面直接附上最终版本的实现
3. Vue3 + TS + ECharts
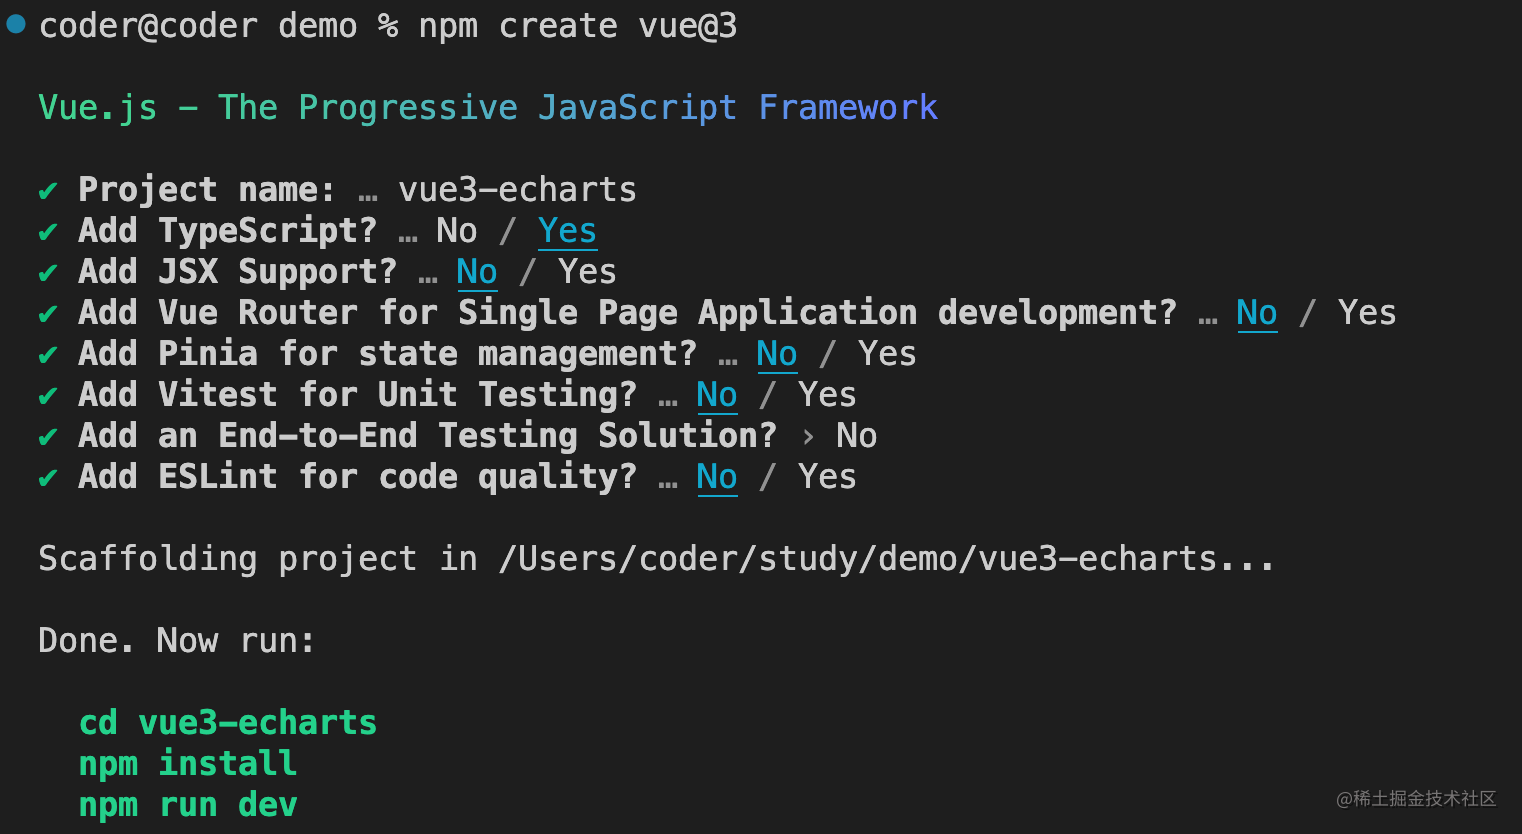
- 通过
vue create创建一个vue3项目

- 安装
echarts
npm install echarts --save
- 目录结构介绍
src:中存放封装的图标组件,BaseEchart作为基础图表,其余图表都在改组件基础上进行二次封装types:作为二次封装组件中需要的类型定义utils:工具文件夹index.ts:统一导出所有图表组件

- 修改
BaseEchart.vue:
<template>
  <div ref="echartRef" :class="props.class" :style="{ width: props.width, height: props.height }"></div>
</template>

<script setup lang="ts">
import { ref, onMounted, onBeforeUnmount, watch } from "vue";
import * as echarts from "echarts";
import useResize from "../utils/resize";
import type { Ref } from "vue";

interface IProps {
  option: echarts.EChartsCoreOption;
  class?: string;
  width?: string;
  height?: string;
}

const props = withDefaults(defineProps<IProps>(), { class: "base-echart", width: "600px", height: "300px" });

const echartRef = ref<HTMLElement | null>(null);
let echartInstance: Ref<echarts.ECharts | null> = ref(null);

onMounted(() => {
  initChart();
});

watch(
  () => props.option,
  () => {
    initChart();
  }
);

onBeforeUnmount(() => {
  if (!echartInstance) {
    return;
  }
  echartInstance.value!.dispose();
  echartInstance.value = null;
});

useResize(echartInstance);

const initChart = () => {
  echartInstance.value = echarts.init(echartRef.value!, "light", {
    renderer: "canvas",
  });
  echartInstance.value.setOption(props.option);
};
</script>

<style scoped></style>
- 在上面的代码中
- 我们创建组件实例不再使用
id,而是直接用ref获取当前组件的el来创建图表(id容易重复每次想id名就很麻烦,而且还要操作dom) - 通过自定义
useResize这样一个hook函数的方式来实现重置图表大小
- 我们创建组件实例不再使用
- 修改
LineEchart.vue
<script setup lang="ts">
import BaseEchart from "./BaseEchart.vue";
import { ref } from "vue";
let option = ref<echarts.EChartsCoreOption>({
  xAxis: {
    type: "category",
    data: ["Mon", "Tue", "Wed", "Thu", "Fri", "Sat", "Sun"],
  },
  yAxis: {
    type: "value",
  },
  series: [
    {
      data: [150, 230, 224, 218, 135, 147, 260],
      type: "line",
    },
  ],
});

setTimeout(() => {
  option.value = {
    xAxis: {
      type: "category",
      boundaryGap: false,
      data: ["Mon", "Tue", "Wed", "Thu", "Fri", "Sat", "Sun"],
    },
    yAxis: {
      type: "value",
    },
    series: [
      {
        data: [820, 932, 901, 934, 1290, 1330, 1320],
        type: "line",
        areaStyle: {},
      },
    ],
  };
}, 2000);
</script>

<template>
  <div class="line-chart">
    <base-echart :option="option" />
  </div>
</template>

<style scoped></style>
- 修改
BarEchart.vue
<script setup lang="ts">
import BaseEchart from "./BaseEchart.vue";
import { ref } from "vue";

let option = ref<echarts.EChartsCoreOption>({
  xAxis: {
    type: "category",
    data: ["Mon", "Tue", "Wed", "Thu", "Fri", "Sat", "Sun"],
  },
  yAxis: {
    type: "value",
  },
  series: [
    {
      data: [120, 200, 150, 80, 70, 110, 130],
      type: "bar",
      showBackground: true,
      backgroundStyle: {
        color: "rgba(180, 180, 180, 0.2)",
      },
    },
  ],
});

setTimeout(() => {
  option.value = {
    title: {
      text: "World Population",
    },
    tooltip: {
      trigger: "axis",
      axisPointer: {
        type: "shadow",
      },
    },
    legend: {},
    grid: {
      left: "3%",
      right: "4%",
      bottom: "3%",
      containLabel: true,
    },
    xAxis: {
      type: "value",
      boundaryGap: [0, 0.01],
    },
    yAxis: {
      type: "category",
      data: ["Brazil", "Indonesia", "USA", "India", "China", "World"],
    },
    series: [
      {
        name: "2011",
        type: "bar",
        data: [18203, 23489, 29034, 104970, 131744, 630230],
      },
      {
        name: "2012",
        type: "bar",
        data: [19325, 23438, 31000, 121594, 134141, 681807],
      },
    ],
  };
}, 2000);
</script>

<template>
  <div class="line-chart">
    <base-echart :option="option" />
  </div>
</template>

<style scoped></style>
- 修改
PieEchart.vue
<script setup lang="ts">
import BaseEchart from "./BaseEchart.vue";
import { ref } from "vue";

let option = ref<echarts.EChartsCoreOption>({
  tooltip: {
    trigger: "item",
  },
  legend: {
    top: "5%",
    left: "center",
  },
  series: [
    {
      name: "Access From",
      type: "pie",
      radius: ["40%", "70%"],
      avoidLabelOverlap: false,
      itemStyle: {
        borderRadius: 10,
        borderColor: "#fff",
        borderWidth: 2,
      },
      label: {
        show: false,
        position: "center",
      },
      emphasis: {
        label: {
          show: true,
          fontSize: 40,
          fontWeight: "bold",
        },
      },
      labelLine: {
        show: false,
      },
      data: [
        { value: 1048, name: "Search Engine" },
        { value: 735, name: "Direct" },
        { value: 580, name: "Email" },
        { value: 484, name: "Union Ads" },
        { value: 300, name: "Video Ads" },
      ],
    },
  ],
});

setTimeout(() => {
  option.value = {
    title: {
      text: "Nightingale Chart",
      subtext: "Fake Data",
      left: "center",
    },
    tooltip: {
      trigger: "item",
      formatter: "{a} <br/>{b} : {c} ({d}%)",
    },
    legend: {
      left: "center",
      top: "bottom",
      data: ["rose1", "rose2", "rose3", "rose4", "rose5", "rose6", "rose7", "rose8"],
    },
    toolbox: {
      show: true,
      feature: {
        mark: { show: true },
        dataView: { show: true, readOnly: false },
        restore: { show: true },
        saveAsImage: { show: true },
      },
    },
    series: [
      {
        name: "Radius Mode",
        type: "pie",
        radius: [20, 80],
        center: ["50%", "60%"],
        roseType: "radius",
        itemStyle: {
          borderRadius: 5,
        },
        label: {
          show: false,
        },
        emphasis: {
          label: {
            show: true,
          },
        },
        data: [
          { value: 40, name: "rose 1" },
          { value: 33, name: "rose 2" },
          { value: 28, name: "rose 3" },
          { value: 22, name: "rose 4" },
          { value: 20, name: "rose 5" },
          { value: 15, name: "rose 6" },
          { value: 12, name: "rose 7" },
          { value: 10, name: "rose 8" },
        ],
      },
    ],
  };
}, 2000);
</script>

<template>
  <div class="line-chart">
    <base-echart :option="option" />
  </div>
</template>

<style scoped></style>
debounce.ts
export function debounce<T extends (...args: any[]) => any>(
  func: T,
  delay: number = 300
): (...args: Parameters<T>) => void {
  let timerId: number | undefined;
  return function debounced(...args: Parameters<T>): void {
    if (timerId) {
      clearTimeout(timerId);
    }
    timerId = setTimeout(() => {
      func(...args);
      timerId = undefined;
    }, delay);
  };
}
useResize.ts
import { onMounted, onActivated, onBeforeUnmount, onDeactivated, ref } from "vue";
import { debounce } from "./debounce";
import type { Ref } from "vue";
import type * as echarts from "echarts";

export default function useResize(chart: Ref<echarts.ECharts | null>) {
  const $_resizeHandler = ref<EventListenerOrEventListenerObject | null>(null);

  onMounted(() => {
    initListener();
  });

  onBeforeUnmount(() => {
    destroyListener();
  });

  onActivated(() => {
    if (!$_resizeHandler.value) {
      // 避免重复初始化
      initListener();
    }

    // 激活保活图表时,自动调整大小
    resize();
  });

  onDeactivated(() => {
    destroyListener();
  });

  const initListener = () => {
    $_resizeHandler.value = debounce(() => {
      console.log("initListener");
      resize();
    }, 100);
    window.addEventListener("resize", $_resizeHandler.value);
  };

  const destroyListener = () => {
    console.log("destroyListener");
    window.removeEventListener("resize", $_resizeHandler.value!);
    $_resizeHandler.value = null;
  };

  const resize = () => {
    console.log("resize", chart);
    chart.value && chart.value.resize();
  };
}
-
在
index.ts中导出所有组件,最终在App.vue中使用 -
最终效果
<script setup lang="ts">
import { LineEchart } from "./components/ECharts";
import { BarEchart } from "./components/ECharts";
import { PieEchart } from "./components/ECharts";
</script>

<template>
  <div>
    <line-echart />
    <bar-echart />
    <pie-echart />
  </div>
</template>


 U8W/U8W-Mini使用与常见问题解决
 分享几个国内免费的ChatGPT镜像网址(亲测有效)
 stm32使用HAL库配置串口中断收发数据(保姆级教程)
 QT多线程的5种用法,通过使用线程解决UI主界面的耗时操作代码,防止界面卡死。...
 SpringSecurity实现前后端分离认证授权