您现在的位置是:首页 >其他 >NodeRED学习(五)http websoket网站首页其他
NodeRED学习(五)http websoket
简介NodeRED学习(五)http websoket
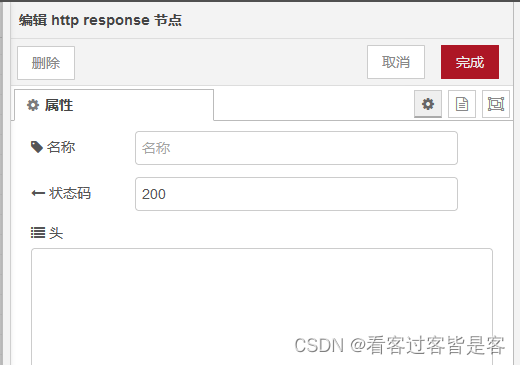
HTTP定义响应内容:


注:可含请求参数
// msg.payload={
//     "demo":"你好"
// }
msg.payload = msg.req.query.content;
return msg;

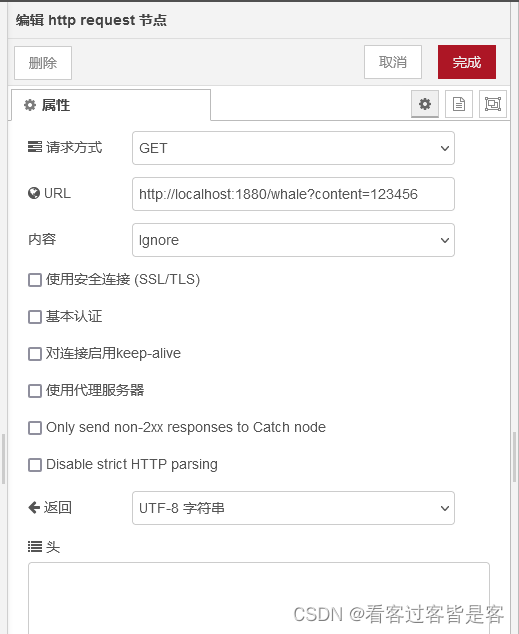
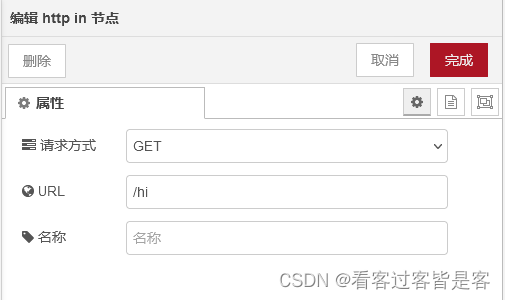
支持浏览器请求测试:IP:1880/(URL)
组件验证请求:


websocket消息:
工具参考:http://www.jsons.cn/websocket/
地址:ws://IP:1880/ws/request
1、配置websocket out给所有客户端发送websocket消息:

“安装插件:node-red-node-random”


2、创建网页websocket连接nodered,展示数据
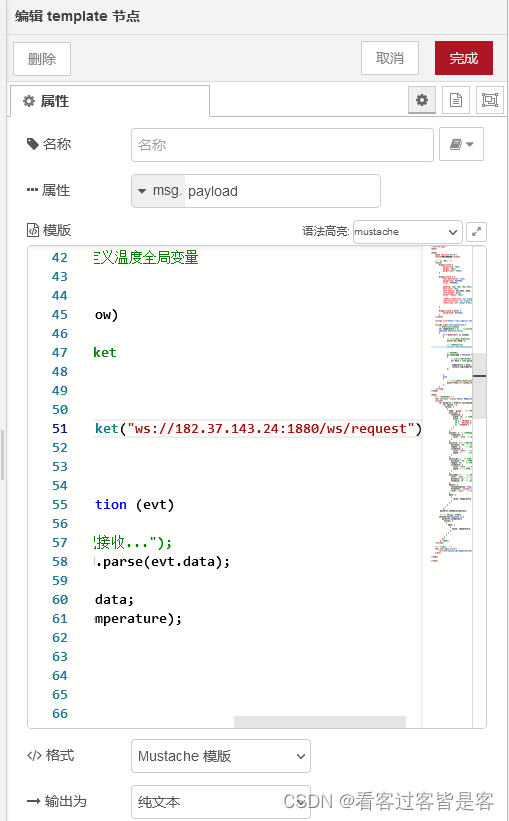
<!DOCTYPE html>
<html>

<head>
    <meta charset="utf-8">
    <title>数据可视化</title>

    <!-- 按钮样式 -->
    <style>
        #login_click {
            margin-top: 40px;
            height: 40px;
            margin-left: 200px;
        }

        #login_click a {
            text-decoration: none;
            background: #67e0e3;
            color: #fd666d;

            padding: 10px 30px 10px 30px;
            font-size: 16px;
            font-family: 微软雅黑, 宋体, Arial, Helvetica, Verdana, sans-serif;
            font-weight: bold;
            border-radius: 30px;

            -webkit-transition: all linear 0.30s;
            -moz-transition: all linear 0.30s;
            transition: all linear 0.30s;

        }

        #login_click a:hover {
            background: #37a2da;
        }
    </style>

    <script src="https://cdn.jsdelivr.net/npm/echarts@5.3.2/dist/echarts.js"></script>

    <script type="text/javascript">
        // WebSocket通信代码
		var temperature = 0;	//定义温度全局变量
		function WebSocketTest()
		{
			if ("WebSocket" in window)
			{
				// 浏览器支持 WebSocket
				alert("调用成功!");

				// 连接WebSocket
				var ws = new WebSocket("ws://IP:1880/ws/request");


				// 接收数据
				ws.onmessage = function (evt)
				{
					// alert("数据已接收...");
					var data = JSON.parse(evt.data);

					 temperature = data;
					 console.log(temperature);
				};


			}
			else
			{
				// 浏览器不支持 WebSocket
				alert("您的浏览器不支持 WebSocket!");
			}
		}
    </script>
</head>

<body>
    <!-- 仪表盘代码 -->
    <div id="main" style="width: 600px;height:400px;"></div>
    <script>
        var mycharts = echarts.init(document.getElementById("main"));
			var option = {
			  series: [
			    {
			      type: 'gauge',  // 图表类型,这里表示仪表盘
			      axisLine: {
			        lineStyle: {
			          width: 30,  // 仪表盘外圈的宽度为30px
			          color: [
			            [0.3, '#67e0e3'],  // 到30%的颜色
			            [0.7, '#37a2da'],  // 到70%的颜色
			            [1, '#fd666d']    // 到100%的颜色
			          ]
			        }
			      },
			      pointer: {  // 仪表盘指针设置
			        itemStyle: {
			          color: 'auto'  // 指针颜色,此处是自动,根据指向的范围变相应的颜色
			        }
			      },
			      axisTick: { // 设置仪表盘上的刻度短线
			        distance: -30,  // 刻度短线的位置
			        length: 8,     // 刻度短线的长度
			        lineStyle: {
			          color: '#fff',  //刻度短线的颜色
			          width: 2       //刻度短线的宽度
			        }
			      },
			      splitLine: {   // 分割线设置,如: 0-10和10-20之间的分割线
			        distance: -30, //分割线位置
			        length: 30,    // 分割线长度
			        lineStyle: {
			          color: '#fff', // 分割线颜色
			          width: 4  // 分割线宽度
			        }
			      },
			      axisLabel: {     // 仪表盘里圈数字设置
			        color: 'auto',  // 设置颜色,此处是:自动
			        distance: 40,  //  里圈数字的位置
			        fontSize: 10   // 里圈数字的大小
			      },
			      detail: {
			        valueAnimation: true,    // 仪表盘显示的值是否有动画效果
			        formatter: '{value} ℃',   // 仪表盘显示的值和单位
			        color: 'auto'   // 仪表盘显示的值数字的颜色
			      },
			      data: [
			        {
			          value: temperature  // 当前仪表盘数值,实际开发中,这里的值是动态变化的。比如从传感器采集而来
			        }
			      ]
			    }
			  ]
			};
		 mycharts.setOption(option);

		 // 每一秒刷新一次表盘
		setInterval(function () {
		   mycharts.setOption({
		     series: [
		       {
		         data: [
		           {
		             value: temperature
		           }
		         ]
		       }
		     ]
		   });
		 }, 1000);
    </script>

    <!-- 连接按钮 -->
    <div id="login_click">
        <a href="javascript:WebSocketTest()">连接 WebSocket</a>
    </div>

</body>

</html>


打开浏览器查看可视化:IP:1880/hi

(3)配置websocket in接收发送的消息并显示


工具端发送消息可以在控制台看到打印输出

风语者!平时喜欢研究各种技术,目前在从事后端开发工作,热爱生活、热爱工作。



 U8W/U8W-Mini使用与常见问题解决
 QT多线程的5种用法,通过使用线程解决UI主界面的耗时操作代码,防止界面卡死。...
 stm32使用HAL库配置串口中断收发数据(保姆级教程)
 分享几个国内免费的ChatGPT镜像网址(亲测有效)
 Allegro16.6差分等长设置及走线总结